Digital Growing in Popularity at Expense of FSI’s
But Does it Move Volume? Buyer Beware.
By Andrew “Dewey” Rumpelt, August 18, 2016

Did you know that digital coupon spending is approaching $1 billion dollars? The CPG industry is experiencing a shift from FSI coupons to Digital. Two key questions still remain: does it move volume like the FSI, and what is the Return on Investment (ROI)?
True, FSI’s still account for 90% of coupons distributed and considered the best vehicle to drive mass awareness at a low cost. However, with Wal-Mart focusing on all things digital and buying Jet.com, we may see even more digital incentives being offered. Many leading industry experts try and compare the distribution of FSI to the prints of Digital coupons however; this is like trying to compare a banana to a fig. The most accurate way to measure and understand FSI and Digital is to look at actual dollars, and subsequently, the ROI between these two vehicles.
FSI Spending is Down
Using the 2015 annual study from Marx, Kantar Media and converting coupons to dollars, we estimate FSI dollar spend totaled $2.5 billion, down -10% or -$287 million vs. the prior year. This is the largest dollar decline in FSI spending ever and signifies that manufacturers may be increasingly turning to Digital incentives.
FSI Retail Co-Op Spending is Down
Second, FSI Retail Co-Op programs, which run adjacent to FSI coupons and feature a retailer outlet with deep price point, have declined by -24%. This significant drop was precipitated by Wal-Mart as they reduced advertising to focus on price, shareholder returns, ecommerce and digital. This, too, signifies that retailers are changing strategies from the FSI Co-Op to other vehicles like Digital.
Digital Coupon Spending is Up
In contrast, Digital coupon spending rose to $799 million, up +18% or +$120 million (based on Marx, Kantar Media). According to industry sources, the trend in 2016 is continuing. These trends would seem to indicate that FSI monies are now funneling into Digital, at the expense of the traditional FSI, a sign that both manufacturers and retailers understand that this group of shoppers is more and more important to reach.
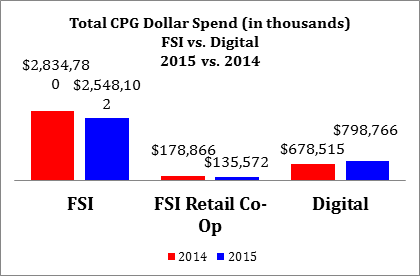
Sources: Marx, Kantar Media 2015 FSI Trends. Dollar spends include estimate redemption rates for non-food and food segments and estimated FSI insertion cost. Redemption spends calculated by number coupons times an estimated redemption rate. Insertion cost assumes that the total cost of an FSI is comprised of 60% redemption and 40% insertion costs, on average.
Return on Investment between FSI and Digital
As digital becomes more widely accepted, an important factor to consider is the Return on Investment or Cost Per Unit Redeemed (CPUR). The CPUR also helps the manufacturer compare different coupon programs and even different values for the same item. In 2015, the CPUR for an FSI is $2.52 vs. $2.93 for Digital.
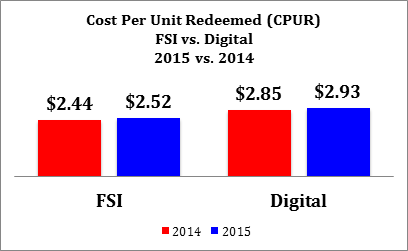
To get a CPUR, we divide the total cost of the coupon promotion with the actual incremental units redeemed to arrive at a cost per unit. (Note: since we don’t have incremental units as part of this analysis, we used total units redeemed). Below are some key definitions for coupon effectiveness, efficiency, and ROI.
- Effectiveness (or Lift) is defined by the amount of incremental sales generated per coupon circulated. Effectiveness can vary based on changes in copy, value, timing, expiration length, new product news, and market selection. Effectiveness is Incremental Units/# of circulations
- Efficiency is defined as the ratios of incremental to total marketing spend from coupon activity. Like Effectiveness, Efficiency can also vary based on changes in copy, value, timing, expiration length, new product news, and market selection. Efficiency is coupon costs + redemption rate* coupons dropped*coupon value/Incremental Units.
- Return on Investment (or payout) is defined as the cost of a program compared to the revenue or margin generated. ROI can be interpreted as the dollars returned for every dollar spend. For example, if a product has a gross margin contribution of $1.50 and coupon efficiency of $3.00 the ROI equals $0.50 or 50% on the dollar. ROI is Gross Margin Contribution/Efficiency.
Declining Redemption Rates Hurting FSI’s
The long-time major advantages of the FSI were “scale” and “low cost” vs. Digital. In a previous article, I compared the pros and cons of both FSI and digital that can be read here FSI vs. Digital Coupons (Pros and Cons). We are seeing redemption rates on FSI’s declining each year, partly due to the FSI vendors increasing the newspapers and expanding their circulation lists among other factors.
Perfect Storm at Play
The perfect storm scenario is at play. The world’s largest retailer is playing catch up in ecommerce, re-focusing on price, reducing advertising spends, acquiring an ecommerce company and attempting to transform itself to compete with Amazon and offer a seamless shopping experience through the use of technology. This will put the pressure on manufacturers and retailers to focus more on digital programs/offers, and ecommerce to keep pace. It will be very interesting to see if the Wal-Mart shopper is ready, and/or if they can bring the upscale online shopper into their franchise.
Move with Caution
The one caution, and it’s a big caution for the CPG industry is not to move too fast from the FSI to Digital. FSI’s still account for significant volume, especially when executed with trade merchandising. Make sure that digital programs are analyzed vs. the FSI. True, redemptions on Digital are higher than FSI print, however, the last few years according to Inmar’s Annual Coupon Trends, redemption on Digital is declining, and this may indicate that it may not be the shiny new object everyone is being led to believe. Digital is here to stay but to what extent is still the question that everyone is trying to figure out. And does it belong on the trade line or consumer line. I guess buyer beware.
About the Author Andy "Dewey" Rumpelt:
Andy "Dewey" Rumpelt has spent 25 years in CPG and is considered an expert on trade, consumer and media insights. Andy started his career at American Home Foods in field sales progressing to brand management on many brands in which trade promotion was a crucial aspect of marketing activities. Andy also worked for ACNielsen. Most recently Andy was Vice President at Kantar Media/Marx, where he provided key insights on consumer FSI, digital, and advertising insights for some of the largest CPG companies in the country. Andy is currently the owner of PRICE-TRAK.
About PRICE-TRAK, National Promotion Reports, LLC (formerly Leemis/PromoData):
PRICE-TRAK provides specialized competitive cost and trade reports, and monitors 150 standard warehouse categories. PRICE-TRAK provides easy to use syndicated reports to monitor price changes and trade allowances. PRICE-TRAK also supports grocery wholesalers to assist with pricing and promotional allowance understanding to help ensure grocery wholesalers have the tools necessary to remain a viable channel.
Contact:
Andrew "Dewey" Rumpelt
PRICE-TRAK
518-599-0526 office
518-275-5464 cell
andy@natpromo.com
###