Total CPG Trade Rate Increased to 15.1% in 2015
With trade promotion spending comprising up to half of brands marketing spend, it remains the most critical component of marketing expenditures. In fact, trade promotion and pricing are undeniably the most important aspects of marketing.
PRICE-TRAK, a marketing service specializing in the reporting of list cost and trade promotion allowances, announced the findings of their “2015 Year End Insight on Trade Promotion Spend”. The study included data that was collected from a confidential panel of wholesalers and retailers and included nearly 40,000 items and over a half million trade promotions or deals.
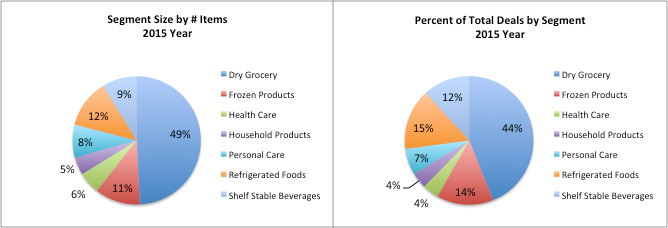
CPG Segment Size and % of Trade Promotions
Dry Grocery makes up 49% of supermarket items yet only accounted for 44% of trade deals. This suggests that Dry Grocery is under promoted as a segment. It may also be that retailers are placing more emphasis and focus on perimeter store items, which are higher priced/higher margin and cater to the on-the-go shopper. Either way, there appears an opportunity for key manufacturers and retailers to breath renewed energy in Center Store by making sure the items are priced right with the appropriate trade discounts and frequency. A renewed emphasis on trade promotions for Center Store can help retailers drive foot traffic and size of the shopping basket.
The average trade allowance for the Total CPG marketplace rate was 15.1%, up 1.7% points from YAGO. This represents a large increase from the 13.4% in 2014. And, considering the size of the CPG marketplace, by some estimates upward of $750 billion in retail sales, the increase represents billions in incremental trade monies.
Total CPG Trade Allowance Rate
The average trade allowance for the Total CPG marketplace rate was 15.1%, up 1.7% points from YAGO. This represents a large increase from the 13.4% in 2014. Trade allowance is defined as the allowance as a percent of unit cost. And, considering the size of the CPG marketplace (by some estimates upward of $750 billion in retail sales) the increase represents billions in incremental trade monies. So, why the increase in trade spending? It is not an easy answer. Most likely a number of factors are driving more trade dollars.
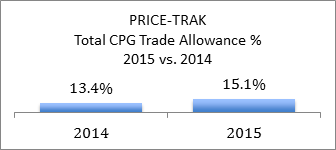
Note: Trade allowance percent is allowance as percent of unit cost, or trade spend as percent of manufacturer price.
First, let’s understand the marketing allocation from a brands point of view. The three core buckets of marketing spending fall into Advertising, Consumer and Trade lines on a brands P&L. These buckets work in harmony, with enormous planning by a team of highly skilled professionals, all following the brands marketing strategy, objectives, and positioning of the brand’s unique selling proposition. The trade plan is usually the core with advertising and consumer promotion layered on top in the planning and execution for maximum impact.
Exhaustive marketing studies help the brand to figure out the right marketing mix and the best messaging to the consumer. Further, as part of annual marketing plans, most brands do a “Lessons Learned” section which reviews every major marketing program done in the prior year to analyze the results and determine if successful. Yes, great advertising can drive sales. However, in today’s environment, the American family isn’t sitting down in front of TV to watch the Wonderful World of Disney, so reaching the consumer is more challenging for marketers.
Millenials are increasing harder to reach with advertising or consumer promotion, they don’t watch TV and don’t read newspapers like the baby boomers. My 18-year-old daughter sits by the fire and watches episodes of X-Files for hours…on her IPhone! Therefore, with media becoming more fragmented, having the right price at retail and providing trade incentives, is critical. Trade allowances can vary widely by category and item, and remain the most important part of the overall marketing mix for brands and retailers.
There are a number of factors driving the increase in trade rates:
- The evolution of Shopper Marketing teams whose purpose is to align brand with retailer objectives to create more cohesive promotion benefiting both.
- The economy…the middle class has not received an increase in their earnings in 12 years and saving money is a top priority for them.
- Private Label provides shoppers with an alternative to major brands. Manufacturers need to offer greater incentives to close the price gap.
- Digital coupon growth is slowing. Although these funds are not included in this study, these monies may be re-allocated to the retailer via traditional trade allowances.
- The renewed importance of in-store promotions, which is tangible, more easily monitored, proven, and can drive sales.
Trade Allowance % by CPG Segment
Interestingly, every major segment posted an increase trade rates. The largest increases were seen in Frozen Foods segment, +2.7% points to 14.2%, and Refrigerated Foods segment, +3.5% points to 13.8%. The fact that every segment increased trade spending reflects an industry wide emphasis to target the shopper at the point of sale or the Red Zone. There is widely quoted statistic that 70 percent of shopper purchase decisions are made in store.
The two outlier segments are Health Care and Shelf Stable Beverages. CCSA and Vitamins drove Health Care declines, while Shelf Stable Beverages significant increase in unit cost was driven by the Coffee category. A mild cold and flu season with abnormally warm temperatures most likely contributed to the need for CCSA brands to move product at lower costs. And for Coffee, Brazil, which produces about one-third of the world’s coffee, suffered an extended drought in 2014, shrinking the country’s coffee output for the 2014-15 harvests, according to the International Coffee Organization.
PRICE-TRAK
Cost & Trade Allowance % by Segment
2015 vs. 2014
| Segment | Unit Cost-AVG | Chg vs 2014 | Trade $ per Unit-AVG | Chg vs 2014 | Net Unit Cost w/Trade $ Allowance | Chg vs 2014 | Trade $ Percent | Chg vs 2014 |
|---|---|---|---|---|---|---|---|---|
| Dry Grocery | $2.23 | $0.09 | $0.35 | $0.05 | $1.88 | $0.05 | 15.0% | 1.5% |
| Frozen Products | $2.72 | $0.10 | $0.38 | $0.09 | $2.33 | $0.01 | 14.2% | 2.7% |
| Health Care | $4.16 | -$0.22 | $0.69 | $0.04 | $3.47 | -$0.26 | 19.4% | 2.0% |
| Household Products | $2.85 | $0.04 | $0.40 | $0.04 | $2.44 | $0.00 | 13.8% | 1.6% |
| Personal Care | $4.38 | $0.02 | $0.57 | $0.00 | $3.82 | $0.02 | 13.4% | 0.1% |
| Refrigerated Foods | $2.46 | $0.08 | $0.32 | $0.06 | $2.14 | $0.03 | 13.8% | 3.5% |
| Shelf Stable Beverages | $2.95 | $0.27 | $0.38 | $0.05 | $2.57 | $0.22 | 13.6% | 1.1% |
In a review of some highly competitive categories based on number of sku’s, Meat/Refrigerated led on a trade rate point change in 2015, up 4.7 percentage points to 14.1%. Most of the below categories are “center-store” and offering deeper and more frequent discounts will certainly help drive foot traffic to the supermarket.
PRICE-TRAK
Cost & Trade Allowance % by Key Categories
2015 vs. 2014
| Category | Unit Cost-AVG | Chg vs 2014 | Trade $ per Unit-AVG | Chg vs 2014 | Trade $ Percent | Chg vs 2014 |
|---|---|---|---|---|---|---|
| Meat/Refrigerated | $2.81 | $0.06 | $0.40 | $0.14 | 14.1% | 4.7% |
| Cheese | $3.49 | $0.21 | $0.49 | $0.16 | 14.1% | 4.0% |
| Vegetables/Shelf | $1.27 | -$0.18 | $0.22 | $0.03 | 17.0% | 3.9% |
| Yogurt | $1.57 | $0.22 | $0.23 | $0.08 | 14.5% | 3.5% |
| Soup | $1.15 | -$0.07 | $0.24 | $0.02 | 20.5% | 2.9% |
| Snacks | $2.42 | $0.07 | $0.48 | $0.08 | 19.8% | 2.9% |
| Jelly/Honey/Peanut Butter | $3.02 | $0.24 | $0.41 | $0.11 | 13.5% | 2.7% |
| Vegetables/Frozen | $1.65 | -$0.03 | $0.26 | $0.04 | 15.7% | 2.7% |
| Potatoes/Frozen | $3.01 | -$0.28 | $0.39 | $0.04 | 13.1% | 2.3% |
| Baking Mixes | $1.77 | -$0.09 | $0.29 | $0.02 | 16.6% | 2.0% |
| Pasta/Macaroni | $1.59 | $0.22 | $0.22 | $0.06 | 13.7% | 1.9% |
| Pet Food & Treats | $3.30 | $0.26 | $0.37 | $0.07 | 11.2% | 1.3% |
| Sauce | $1.78 | $0.02 | $0.28 | $0.02 | 15.9% | 1.1% |
| Olives/Pickles/Pepers | $2.18 | $0.12 | $0.31 | $0.03 | 14.2% | 0.6% |
| Cereals | $2.56 | -$0.13 | $0.47 | -$0.02 | 18.3% | 0.1% |
Conclusion
In 2016, given the continued fragmented media landscape and challenges of brands to reach the consumer, we can expect continued emphasis on trade spending by manufacturers. The CPG industry will continue to emphasize ways for manufacturers and retailers to work together to not only drive effective trade spending, but also creating value for the shopper. One tried and true way is through the expanded use of trade monies. After all, the Red Zone is where all the action happens, and the shopper likes deals more than anyone!
About PRICE-TRAK, National Promotion Reports, LLC (formerly Leemis):
PRICE-TRAK provides specialized competitive cost and trade reports, and monitors 150 standard warehouse categories. PRICE-TRAK provides easy to use syndicated reports to monitor price changes and trade allowances. PRICE-TRAK also supports grocery wholesalers to assist with pricing and promotional allowance understanding to help ensure grocery wholesalers have the tools necessary to remain a viable channel. For more information on this study or other inquiries, please contact andy@natpromo.com or 518-275-5464.
About the Author Andy Rumpelt:
Andy Rumpelt has spent 25 years in CPG and is an expert on trade, consumer and media insights. Andy started his career at American Home Foods in field sales and then progressed to brand management on many brands in which trade promotion was a crucial aspect of marketing activities. Following AHF, and worked for ACNielsen. During the past 13 years, Andy was a VP at Kantar Media/Marx, where he provided key insights on consumer FSI, digital, and advertising insights for some of the largest CPG companies in the country.
Contact:
Andrew Rumpelt
PRICE-TRAK
518-599-0526 office
518-275-5464 cell
andy@natpromo.com
###